Hi,
I've attached a FIB extension on a chart. I'm probably doing something super simple but I can't see the extensions as they are all crammed along the y axis on the right hand side (obscuring the numbers)
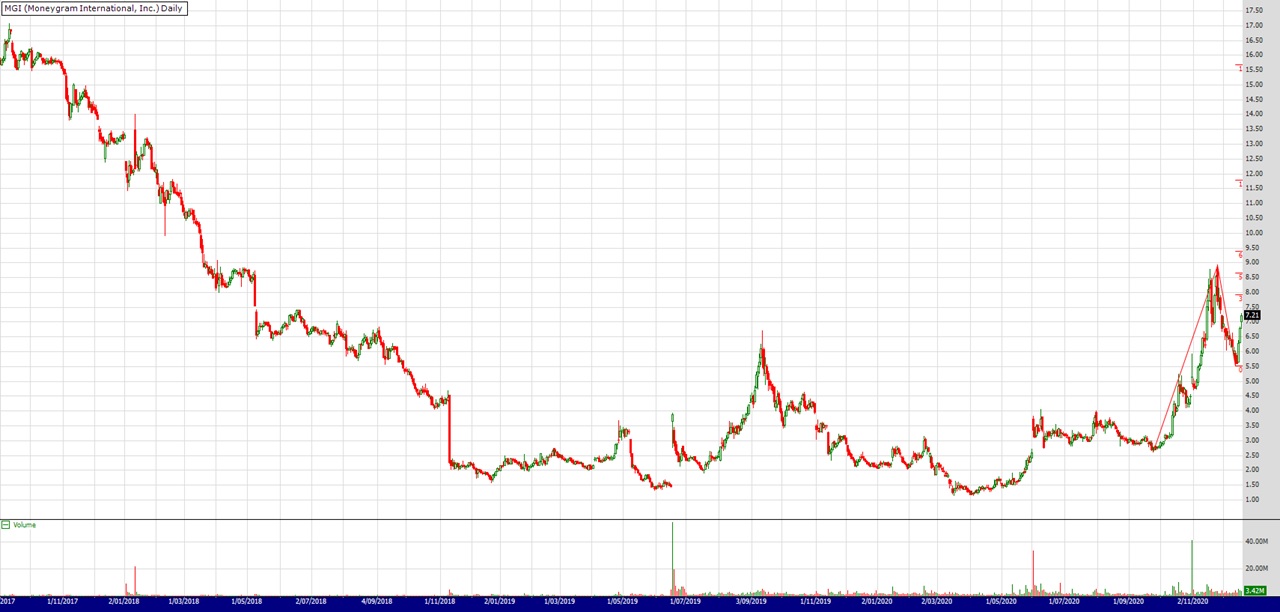
Any way to see them?
Thanks
Size:
Color:
Hi,
It happens when a peak is set too close to the right edge. This way there's no room to render them on the chart. There is no workaround for charts or Rules but for code-based strategies it's very simple:
CODE:
Please log in to see this code.
If you do it all the time on every chart then it may make sense to append the workaround code to the default strategy template by Edit >
Set as Default Template Code.
Size:
Color:
Thanks Eugene,
I do want to look at this on all charts so that Default workaround makes sense.
I wasn't sure how to put that into a 'new strategy' so I clicked dropdown....New/New strategy from code and then pop up with general template appeared. I pasted your line in , add new strategy from code.
Can I run general charts from this? I am trying - just a novice at this.....
CODE:
Please log in to see this code.
Size:
Color:
This is the order it should be:
CODE:
Please log in to see this code.
Size:
Color:
Hi Eugene,
Ok very helpful, got that working and I can play with the spacing. Nice.
Last bit. If you look at attachment for a stock, I can't scroll up the y axis to see where the Fib extensions are outside the 50% ( in this case) projection. Is there a way to 'drag' down the chart to 'see' those upper bands?
Thanks
Size:
Color:
Size:
Color:
Hi, went to link post #3
I pasted in the code and not sure if the double top bit should be there but I have a few errors - see snapshot. Have tried a few variants too. Code below (including the extend pane bit from above)
CODE:
Please log in to see this code.
Size:
Color:
Do
not include
any plotting directives like
CODE:
Please log in to see this code.
inside
any FOR loops. Plots and plotting directives should probably come
before any FOR loops begin.
Also, it's hard to read your code when you don't indent it on the forum. Many mistakes will be missed (like matching {...}) with poorly formatted code.
Size:
Color: